Date
Aug 23, 2019
Category
Coding
Reading Time
8 Min
Publicis Sapient | QA Analytics Automation
This tool is the perfect solution for pairing Adobe Analytics with your QA process. Using chromedriver, Selenium IDE, and a simple but intuitive GUI, this tool can parse the target website's source code and return summary of all Adobe Analytics data from every page load. Additionally, utilizing selenium's IDE, the user can set up additional QA tests for future use and multiple testing sessions (i.e. form filling, navigation, etc.).

Source code: https://github.com/sherriejudy/QA-analytics-automation
Contributors: Adesh Kadambi, Judy Hu, Raman Mangla
Introduction
This tool is the perfect solution for pairing Adobe Analytics with your QA process. Using chromedriver, Selenium IDE, and a simple but intuitive GUI, this tool can parse the target website's source code and return summary of all Adobe Analytics data from every page load. Additionally, utilizing selenium's IDE, the user can set up additional QA tests for future use and multiple testing sessions (i.e. form filling, navigation, etc.).
Motivation
The motivation behind this project is to reduce the amount of time and QA testers need to spend collecting Adobe Analytics data from newly redesigned Shaw website. Historically, the testers from the Data Science and Analytics teams needed to navigate to every page of the website and manually collect data from the page and write them into an excel spreadsheet. This is a process that takes hours and is prone to human error. This software aims to eliminate this manual process, allowing QA testers to perform their routines quicker and more accurately.
Project Setup
Clone the repository on your local machine.
Install Python 3 (https://www.python.org/downloads/)
Navigate to the project directory using the Command Line.
Create a virtual environment in the project directory:
Install virtualenv library:
pip install virtualenvCreate a virtual environment:
virtualenv virtual-env-nameStart virtual environment:
source virtual-env-name/bin/activateClosing virtual environment (after your work is done):
deactivate
Install Python dependencies
pip install -r requirements.txt
Run - Page Loads
Navigate to the project directory using Command Line
Activate the virtual environment
source virtual-env-name/bin/activateRun the main Python script to access GUI
pythonw [Analytics.py](<http://analytics.py/>)Graphical User Interface (GUI)
GUI (Analytics QA Bot) should pop up behind an empty chrome window. Note: do not close this chrome window!
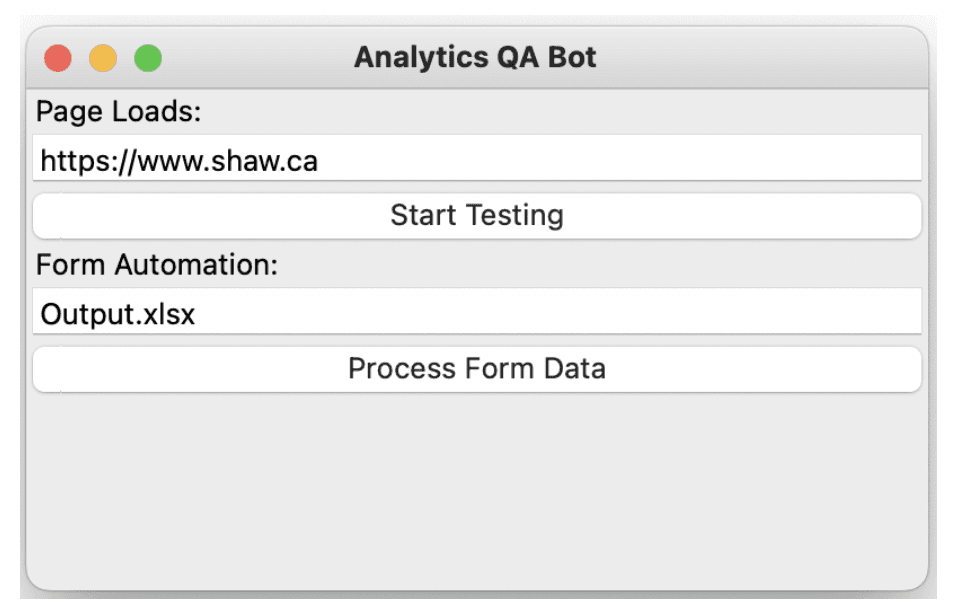
Enter the test site URL into the Page Loads text field
Click Start Testing
When testing is done, go into Downloads
Open the Excel file containing all the Adobe Analytics data
Run - Form Filling
Navigate to the project directory using Command Line
Activate the virtual environment
source virtual-env-name/bin/activateRun the main Python script to access GUI
pythonw [Analytics.py](<http://analytics.py/>)Graphical User Interface (GUI)
GUI (Analytics QA Bot) should pop up behind an empty chrome window. Note: do not close this chrome window!
On the empty Chrome window open the Selenium IDE extension where you will have the option to create a new test or open an old project and run the tests
Recording the test initially is a good start for setting up tests but fine tuning them and inserting steps that don't work manually ensures that Selenium can find all elements
Reducing test speed has been shown to produce better results with fewer errors
For more information on how to use Selenium IDE visit: (https://www.seleniumhq.org/selenium- ide/docs/en/introduction/getting-started/)
Once testing is complete input the desired output file name in Form Automation text field
click Process Form Data
Open the Downloads folder which will contain the output file that was previously specified along with a product-strings.csv file that contains all the product strings (if any) parsed in an easy to read format.
Open the Excel file containing all the Adobe Analytics data
Output
The project opens a Chrome window and navigates to various links found on the provided website. The final output is an Excel sheet, containing the processed Adobe Analytics data with a processed product string, in the Downloads folder of the user. Navigate to the Excel sheet named summary in the very end, to find all page loads in one Excel sheet.
Architecture Diagram

Figure 1: Architecture Diagram with Contribution Labels
Components
WX Python WX Python is a python library for creating graphical user interfaces (GUIs). It was chosen for use in this project due to its simplicity and flexibility. It also has support for multiple platforms, allowing the application to be used on a wide variety of systems and versions. Additionally, it is open source and free, which makes it a great option for a budget-constrained project. Finally, WX Python is well documented, making it easy for us to learn and use.
Form Automation The Form Automation component was written by Adesh and enables users of the tool to create their own tests and form inputs. This is especially handy when the website changes and the previous instructions are no longer valid for the newer formats. This could have been hardcoded into each version of the tool or provided in a manifest or manually written instructions file but using Selenium built-in GUI interaction logger was a far more flexible, scalable, and powerful way to accomplish this task.
Page Loader The Page Loader component was written by Judy (me) and is the core mechanism that fetches the pages and recursively identifies the additional areas that need to be traversed on the website. Recursion was used as this problem is recursive by nature, resulting in natural looking and easily understandable code. Beautiful Soup 4 (BS4) was used in this section for its performance, ease of use, good documentation, and permissive license. The endpoint processor had the job of collecting the anchor tags from BS4 and ensuring all endpoints were valid and unique. Regex was used to validate the endpoints for validity and to reject certain buttons that used pure JS to perform the navigation. Then the endpoints were stripped, normalized, and put into a set to ensure uniqueness and good performance, even when the number of endpoints gets large. The final result of the endpoints were sent over to the Adobe Analytics Aggregator where they were processed and cross-checked with the Adobe Analytics data source.
Adobe Analytics Aggregator
The Adobe Analytics Aggregator component was written by Raman and is the final step in the process. This component expects a list of endpoints for all the links provided on the page that was specified and iterates through them while verifying and retrieving the IDs from the Adobe Analytics data source. This component also uses Selenium webdriver to navigate to the appropriate webpages and uses the instructions provided by the Form Automation component to perform the tests that the testers have previously specified. All of these results are logged and sent to the aggregator. When all of the endpoints have been completed, the aggregator does a final pass on all the calculations and returns a final, properly formatted csv that the testers are able to use.
Conclusion
The result of this project is that the Data Science and Analytics teams can collect the data they care about in far less time and with far greater accuracy. The team members were also incredibly happy that they no longer needed to waste their time performing menial labour and were able to spend their time doing actual analysis on their data instead. Based on rough calculations that were done on the team, it’s likely that this simple tool improves the testing time by 30% and saves around $500 every time it’s used to in-place of the old manual testing just from salary saved and not including quality of life improvements.